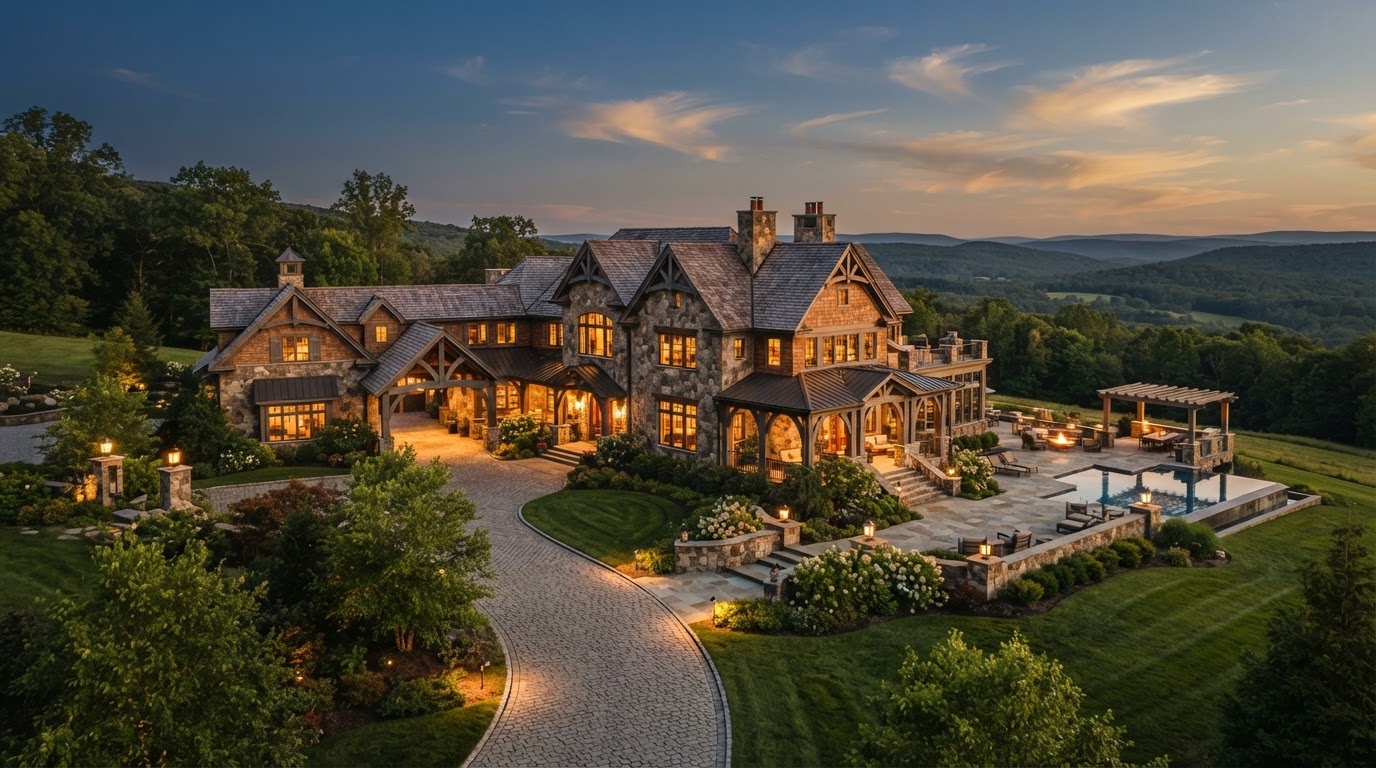

The Harrisburg skyline along the Susquehanna — the heart of the Harrisburg-Carlisle metro whose trends shape every Central PA home sale.
Pricing a home isn't a one-time decision — it's a moving target shaped by live market trends that shift week to week. Median sold prices, days on market, sale-to-list ratios, and inventory levels across the Harrisburg-Carlisle metro all influence when to list and what to ask. Here's the latest 2026 trend data for the counties we serve, and how we translate it into a pricing and timing strategy for your sale.
Why live trends matter more than last quarter's report.
Real estate data has a lag. A closed sale today reflects a contract signed 30–60 days ago, which reflects a listing from 30–60 days before that. By the time a quarterly market report is published, the market it describes may have already moved. That's why we track live indicators — pending sales, active inventory, price reductions, and showing activity — alongside the closed-sale data, so your pricing strategy reflects what's happening right now, not three months ago. A seller who prices off a stale report prices for a market that no longer exists.
Median sold prices across the region.
Based on recent data compiled from Realtor.com, Redfin, and Zillow, the Harrisburg-Carlisle metro's communities show a clear price hierarchy. Camp Hill's median sold price sits around $310,000–$340,000. Mechanicsburg's broader market median ranges from $367,000–$406,000 depending on the data source and geographic definition. Enola and East Pennsboro Township typically run in the $250,000–$290,000 range. New Cumberland and Lemoyne sit between $230,000 and $270,000. On the East Shore, Harrisburg city's median is considerably lower — often $160,000–$190,000 — reflecting its urban rowhome stock. Lower Paxton Township and Colonial Park generally command $280,000–$340,000, Hummelstown around $290,000–$330,000, and Hershey remains the region's premium market with medians frequently exceeding $450,000–$500,000. Carlisle runs roughly $260,000–$300,000, Lancaster city around $260,000–$300,000, and York city around $160,000–$190,000.
Days on market and the speed of the sale.
Days on market (DOM) measures how long a home sits between listing and going under contract. Across the region, well-priced, move-in-ready homes in desirable school districts routinely go under contract in under two weeks, while overpriced or condition-challenged homes can sit 60–90 days or more. Camp Hill's average DOM runs roughly 25–35 days for the broader market but under two weeks for the best-priced homes. Mechanicsburg tracks similarly. Hershey's premium homes can take longer to find the right buyer but command stronger prices when they sell. The takeaway: DOM is a pricing diagnostic. If your home is sitting past the average for its neighborhood, the market is telling you something — usually that the price is ahead of the data.
Sale-to-list ratio: are homes selling at asking? The sale-to-list ratio measures the final sold price as a percentage of the final list price. A ratio of 99% means homes are selling, on average, for 99% of what they're listed at. Across the Harrisburg-Carlisle metro, the sale-to-list ratio runs near 97–99% in most communities, meaning well-priced homes sell very close to asking. In tight, high-demand pockets — a well-priced Camp Hill colonial, a move-in-ready Mechanicsburg home in Cumberland Valley schools — we still see multiple-offer situations that push the ratio above 100%. A ratio below 96% in a neighborhood that usually runs higher is a signal of softening demand or overpricing. We track this ratio by neighborhood and price band, not just county-wide, because the averages mask wide variation.
Inventory levels and months of supply.
Months of supply measures how long it would take to sell every active listing at the current sales pace, assuming no new listings. Six months is generally considered a balanced market; below that is a seller's market, above it a buyer's market. Across the West Shore, inventory has been running below balanced levels — Mechanicsburg's inventory is down roughly 7% year over year — which is why well-priced homes sell fast and competition among buyers remains strong. The East Shore shows more variation: tight in the desirable suburbs, more balanced in the urban core. When we price your home, we look at the months of supply in your specific price band and neighborhood, because a region-wide average hides the fact that the $300,000–$400,000 band in Camp Hill may be a fierce seller's market while the $600,000+ band in the same town may be balanced.
Year-over-year price trends.
The direction of prices matters as much as the level. Across the Harrisburg-Carlisle metro, median sold prices have generally trended modestly upward year over year, though the rate of appreciation has cooled from the rapid gains of 2020–2022. Cumberland County's median owner-occupied home value is approximately $277,600 per the 2020–2024 American Community Survey, roughly 17.4% higher than Dauphin County's $236,400. Population growth reinforces the trend: the U.S. Census Bureau estimates Cumberland County's population at roughly 277,270 as of 2025, up 6.9% (about 17,800 residents) since the 2020 Census — growth concentrated in Mechanicsburg, Hampden Township, Upper Allen Township, and Silver Spring Township. That growth pressure is a key reason West Shore inventory stays tight and prices skew higher.
Absorption rate and what it tells us.
The absorption rate is the rate at which available homes are being sold. It's calculated by dividing the number of homes sold in a given period by the number of active listings. A high absorption rate means homes are selling quickly relative to supply — a seller's market. A low absorption rate means supply is outpacing demand — a buyer's market. We calculate the absorption rate for your specific neighborhood and price band, because a county-wide figure is too coarse to guide a pricing decision. If the absorption rate in your segment is high, we may price slightly more aggressively; if it's low, we price to the data and prepare for a longer market time.
Price reduction data: the warning sign.
We track price reductions — listings that have dropped their asking price — as an early indicator of market softening or overpricing. A spike in price reductions in a neighborhood often precedes a broader price correction, because it signals that sellers (and their agents) initially priced above what the market would bear. When we see a rising reduction rate in your area, we factor it into the recommended list price: better to price right the first time than to join the reduction list, because a price-reduced listing often nets less than one priced correctly from day one.
Mortgage rates and buyer demand.
Mortgage rates directly shape buyer purchasing power, which in turn shapes demand for your home. When rates rise, a buyer's monthly payment for the same loan amount increases, which effectively reduces what they can afford — and can soften demand at the margins, particularly for first-time and price-sensitive buyers. When rates fall, purchasing power expands and demand typically strengthens. We don't try to time the market on rate movements, but we do factor the current rate environment into our pricing and our expectations for showing volume and offer strength. In a higher-rate environment, pricing precisely matters even more, because buyers have less room to stretch.
Seasonal patterns in Central PA.
The Central PA market follows a recognizable seasonal rhythm. Spring (March–May) is typically the busiest season, with the most new listings and the most active buyers — ideal for sellers who want maximum exposure and competition. Summer (June–August) remains active but begins to slow as families settle in before the school year. Fall (September–November) sees a secondary wave of serious buyers who need to move, often with less competition. Winter (December–February) is the slowest season but can favor motivated sellers, because the buyers who are out are serious and inventory is low. We help you choose a listing timing that matches your goals and the seasonal dynamics of your specific neighborhood.
How we use all of this to price and time your sale.
We don't hand you a single number and hope. We present the live trend data for your neighborhood and price band — median sold prices, DOM, sale-to-list ratio, months of supply, absorption rate, and price-reduction trends — alongside your comparable sales analysis, and we translate it into a clear recommendation: what to list for, when to list, and what to expect in terms of showings, timeline, and likely outcome. If the data says it's a strong seller's market in your segment, we may price slightly aggressively to test the ceiling. If the data says it's softening, we price to the data to sell cleanly without a reduction. Ready to see what the live trends say about your home's value? Aaron Rissinger and Josh Krevsky — Living in Central PA Team | Iron Valley Real Estate of Central PA — 717-REALTOR (717-732-5867).
Key Takeaways
- Live trends (pending sales, active inventory) matter more than lagging quarterly reports
- Camp Hill median ~$310K–$340K; Mechanicsburg ~$367K–$406K; Hershey $450K–$500K+
- Well-priced homes in desirable districts routinely go under contract in under two weeks
- Sale-to-list ratio runs near 97–99% region-wide; above 100% in tight pockets
- Months of supply below 6 = seller's market; West Shore inventory down ~7% YoY
- Cumberland Co. population grew 6.9% since 2020, pressuring West Shore inventory
- Track price reductions as an early softening/overpricing indicator
- Mortgage rates shape buyer purchasing power and demand at the margins
- Spring is peak; winter is slowest but favors motivated sellers with low inventory